The working capital edition: PE's fastest value lever
Oct 27, 2026Operational alpha for PE funds, their portfolio companies and operating partners. What we deliver: operational efficiency and speed to intelligence, AI that drives EBITDA, exits and DPI.
In this issue
 | Quiz: where PE firms ranked working capital. Answer at the end |
 | For operating partners: what fast cash gives you |
 | Signal: big companies are waiting longer to get paid |
 | Working capital areas: where cash hides in manufacturers and distributors |
 | Why us: one platform for cash, customers, pricing and demand |
 | On the radar: recap headroom and the buyer's working capital audit |
 | Calculator: how much cash is stuck in one of your companies |
Quick question
What did PE firms rank as the best way to create value in a portfolio company?
Their top three for 2026:
1ST M&A Buy and build |
2ND Expansion Products and markets |
3RD Pricing Price and margin |
None of these delivered results fastest. So where on the list do you think working capital came? Find out at the end.
Your guess
Pick one. We will tell you at the end.

Make it yours
Two ways to shape it. Name a topic and we fold it into the next issue. Or get your own edition, on your themes, sent only to you, one-off or monthly.
Tell us what you wantFor your fund this month
Read this with one portfolio company in mind: the one where finance and operations would give you two different numbers for stock. Somewhere in that gap is cash the company could put to work, at a time when MSCI has distributions running at about a third of their historical norm.
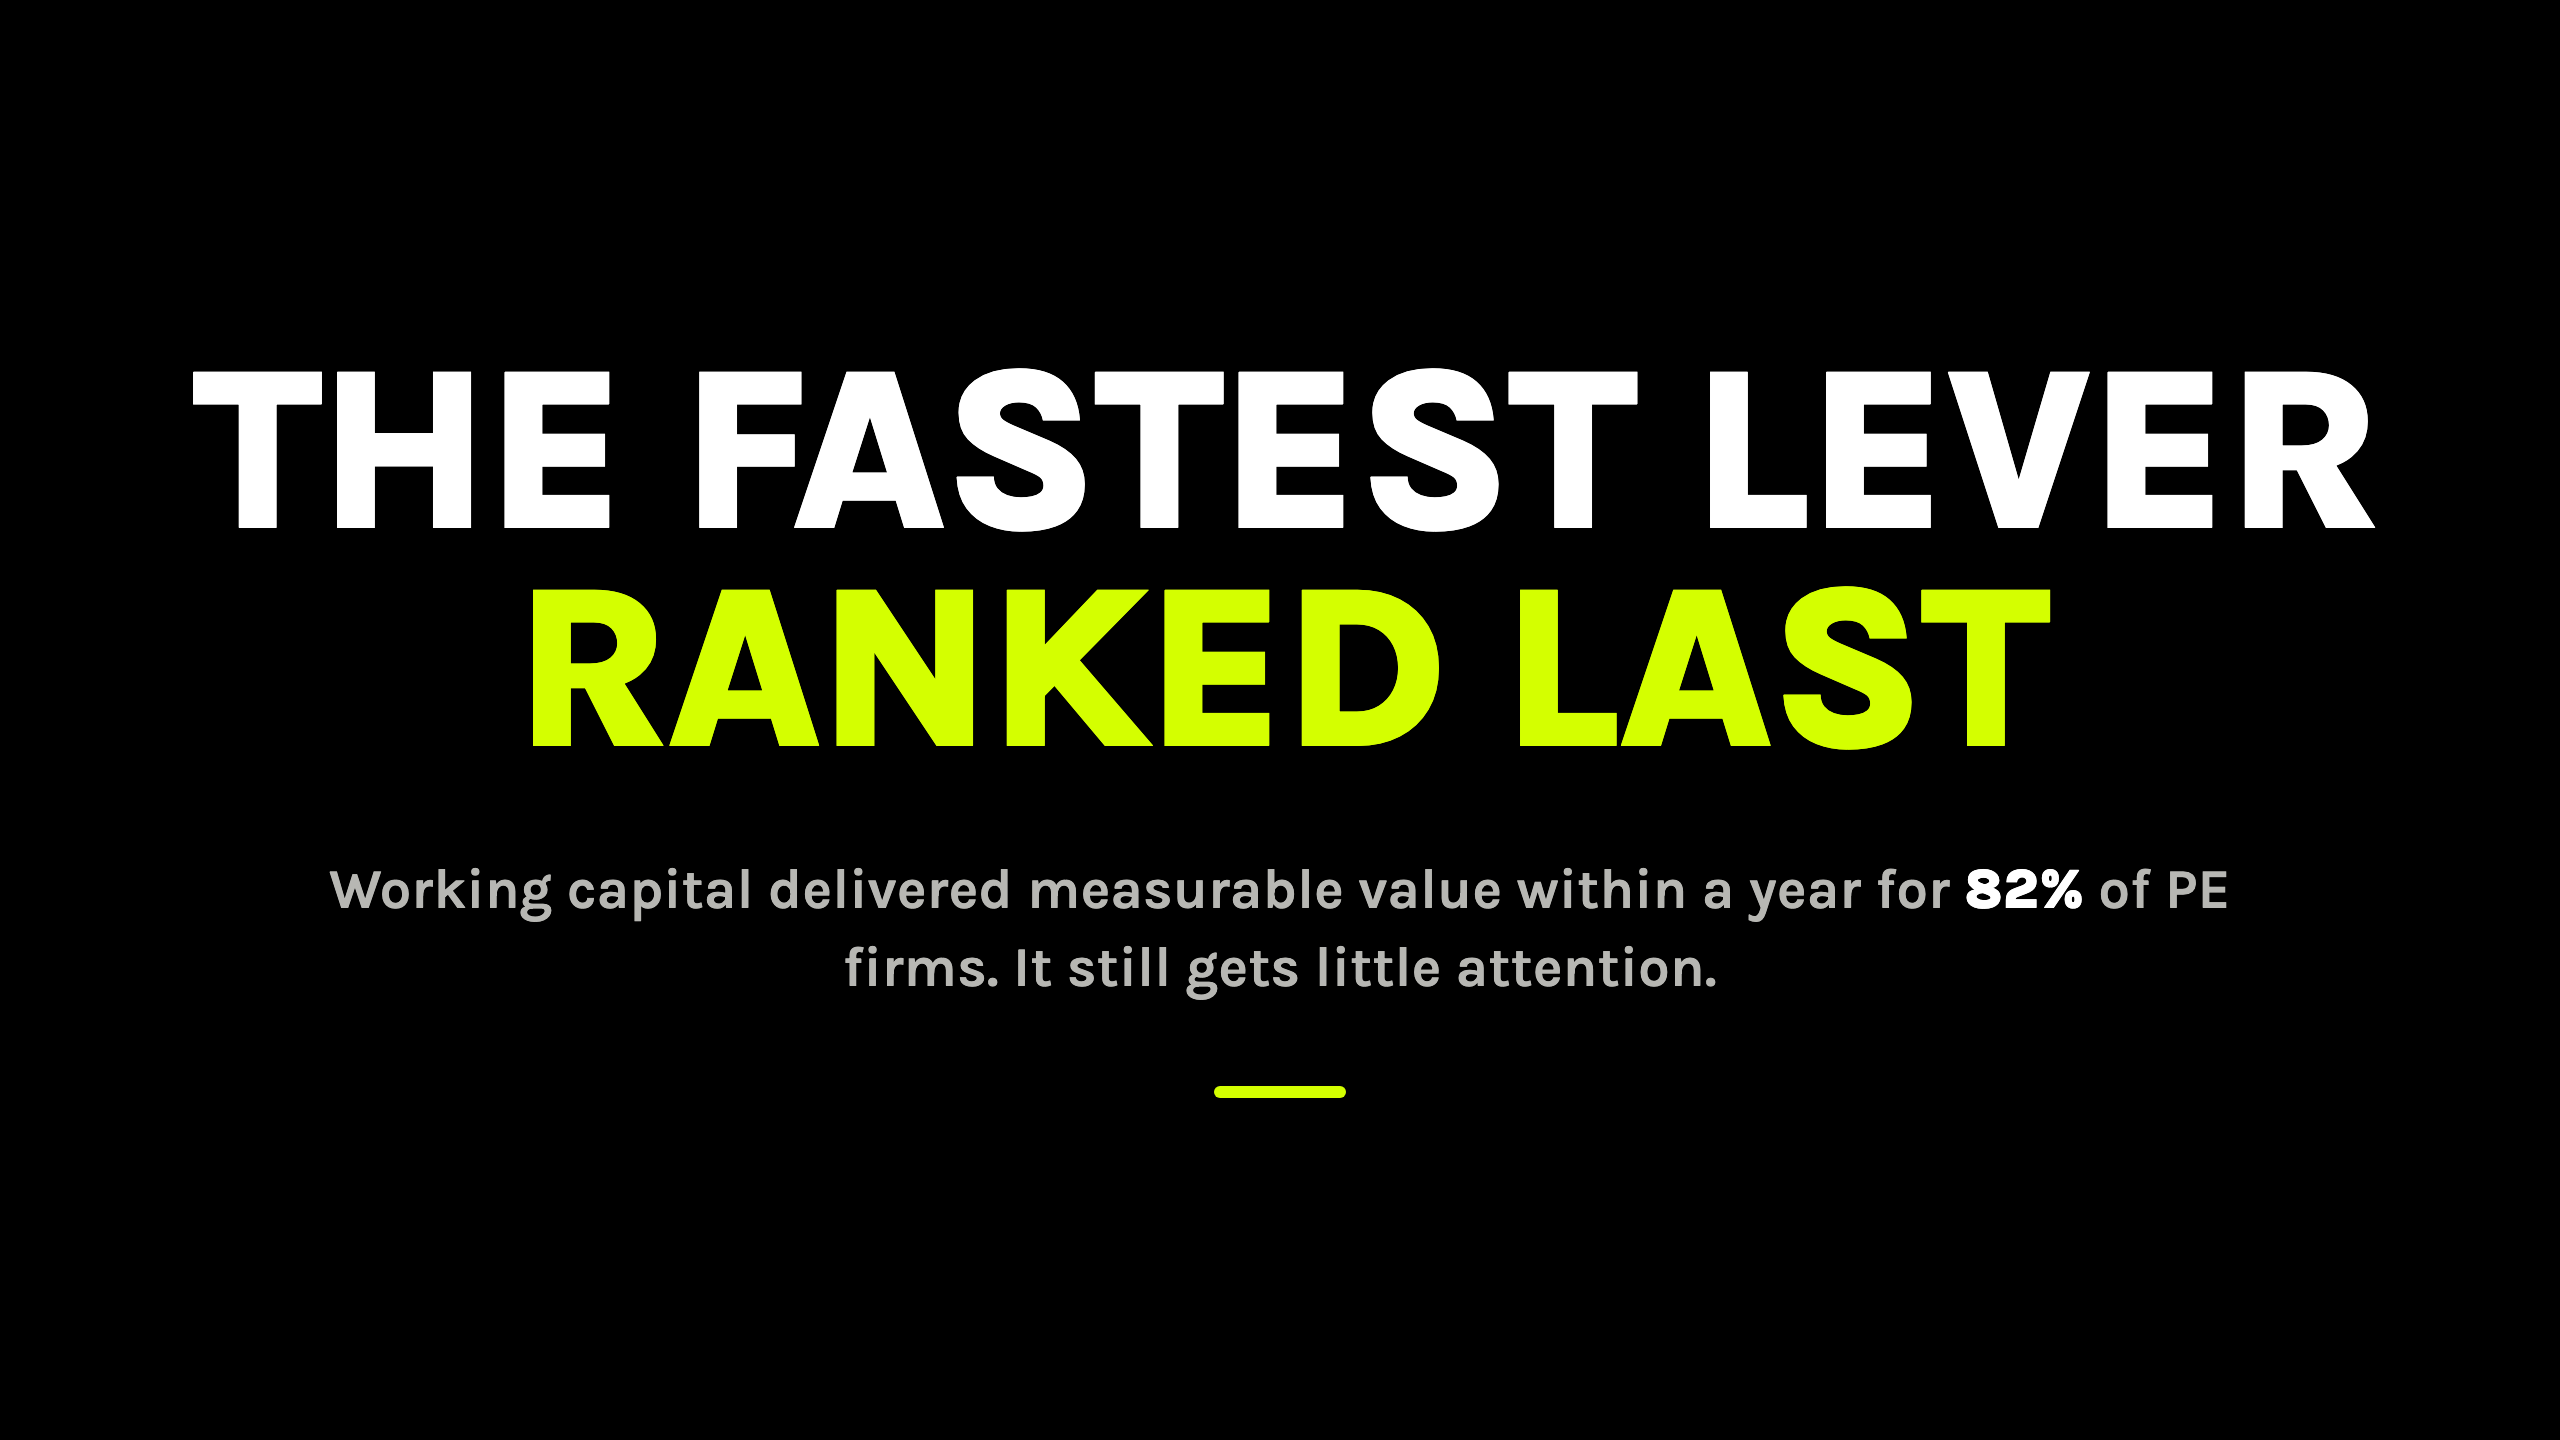
Working capital delivers results faster than any other lever. Few funds make it a priority.
Debt costs more and companies are being held for longer, so the cash inside each business matters more than it has for years. When 555 PE leaders were surveyed this summer, working capital came out ahead of every other lever: 55% of firms saw measurable value within six months, and 82% within twelve, against an average of 63% (FTI).
And the first release is only the start. Run receivables, stock and supplier terms well every day, and the gains keep building through the hold. That is the hard part. In most portfolios we see, the data sits in pieces across systems, and pulling it together takes a lot of manual work. That is what we fix, alongside the other high-impact areas in the business.
Fast cash gives you room to move. Released from receivables and stock, it can fund the investment plan without new borrowing, take pressure off the debt, or strengthen the balance sheet before a sale. Cash managed every day also shows a buyer the gains are built in, not a squeeze before exit. Yet working capital still gets little attention in most value creation plans.
The signalThe read: they kept cash flat by paying their own suppliers later.
The Hackett Group's survey of the 1,000 largest North American companies (5 Oct): a record $1.94tn of cash they could release from working capital.
$1.94tn Cash they could release from working capital. A record. |
$773bn Of that, in what customers owe, up 29%. Paid later in 40 of 50 industries. |
$616bn Of that, in stock, up 6%, held against tariff risk. |
Source: The Hackett Group, 2026 Working Capital Survey (Business Wire, 5 Oct)
Customer payments get most of the attention, and plenty of software already chases them. The harder cash to release sits in stock, $616bn of it in this survey. In a manufacturer or distributor, releasing it starts with numbers everyone trusts: one stock figure that finance and operations agree on, a true weighted average cost for every product, and market prices alongside, so the real worth of each line is clear. With that in place, intelligence running on the company's own data can set stock levels by warehouse, plan the supply chain around real demand, and show each team where it stands. This is the work we specialise in. It frees cash to grow or pay down debt, and protects margin on every sale.
Working capital areasPatterns we see across industrial manufacturers and distributors
Operations records what is made, stored and shipped. Finance records what is invoiced, paid and banked. The two rarely match, the numbers sit in several systems, and pulling them together is slow, manual work. Working capital is also the lever AI has reached least: only 5% of PE firms name AI as the main driver of their working capital results, against 18% for pricing (FTI).
| Where the cash hides | What you need | |
|---|---|---|
| Customers paying late. Found once the invoice is already overdue. | Late payers forecast from their payment history, and the reminder drafted before the due date. |
 | Two numbers for stock. Finance and operations disagree. | Stock, ledger and bank reconciled every day, with each variance explained. |
 | Stock nobody can see. In transit, between sites, or under several product names. | Every unit tracked from order to shelf, with one number per product. |
 | Aged stock nobody owns. Found by the auditor. | Aged lines flagged daily to the person who can move them. |
 | Suppliers chased by hand. Late shipments, missing documents. | Suppliers chased automatically, with only what is stuck escalated. |
 | Contract terms in a drawer. Invoices never checked against them. | Contracts read, and every invoice and order checked against them. |
OEX handles each of these. How it works is in the next section.
Why usOne platform for cash, customers, pricing and demand.
OEX is our Operational Excellence platform, built for industrial manufacturers and distributors. It sits on the systems you already run and works through the right-hand column above every day.
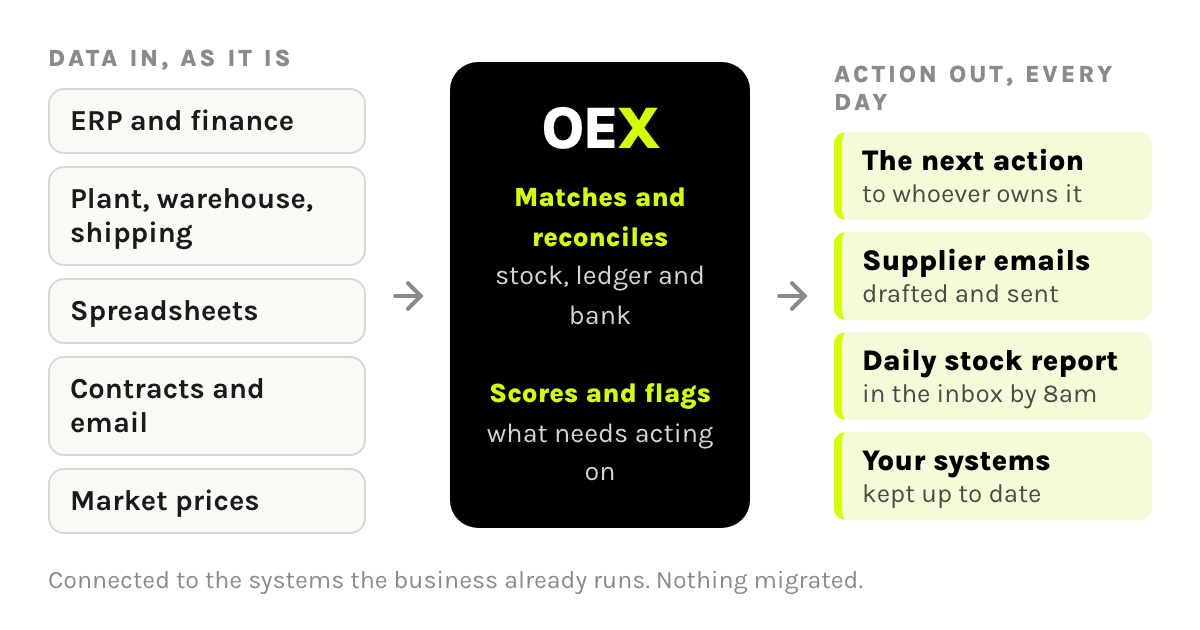
OEX runs flows built around your business. Here is one, for clearing slow stock:
 01 Highlight Slow and blocked stock, flagged by lot. |
 02 Suggest Clear it, hold it or move it. |
 03 Email the supplier Drafted for you: hold the next inbound. |
04 Unblock Released stock, back on sale. |
= more working capital, released faster.
Working capital is one problem OEX solves. The same platform, on the same data, runs others too:
 Keep customers Customers buying less, flagged to the rep before they leave. | Grow accounts Customers who are growing but have nobody covering them, sent to a rep. |
 Hold margin Prices that have fallen behind cost, caught on every order. |  Sense demand One forecast the plant and buyers plan from, with real demand split from orders placed early. |
Each new problem is a new flow on the platform you already have, not a new system.
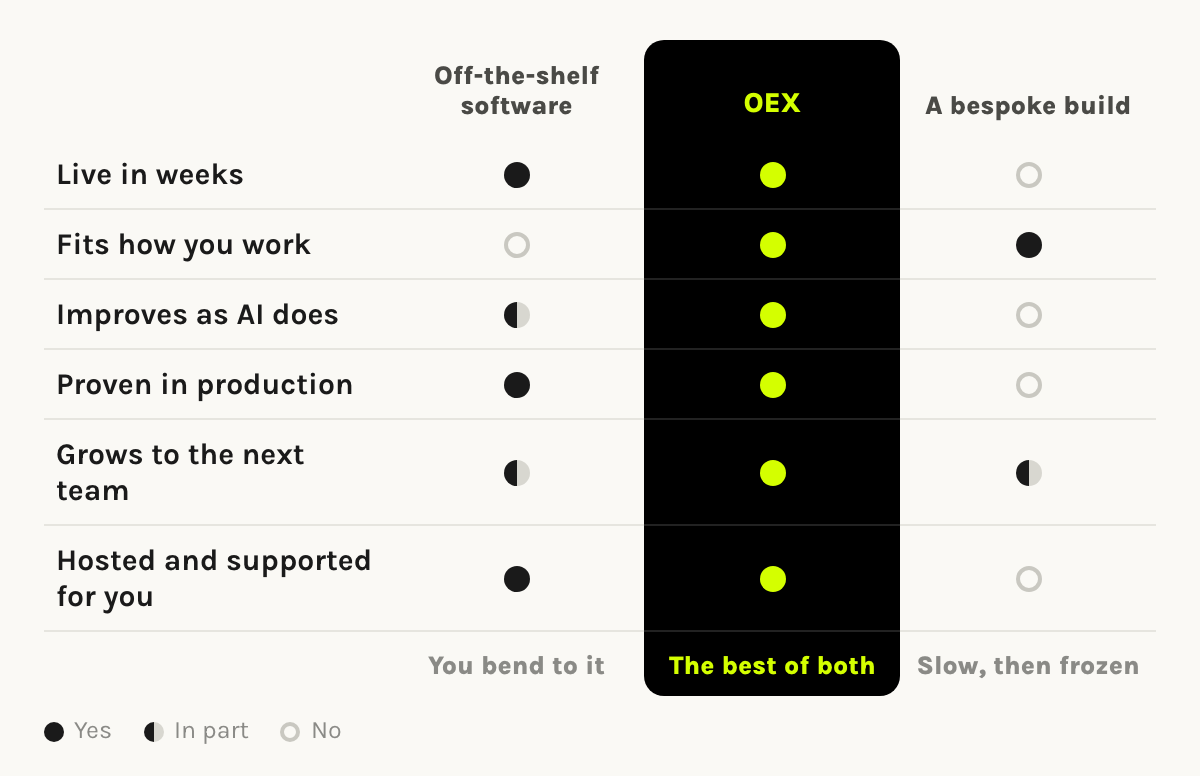
Want to see what OEX would find in one of your companies? Talk to us about OEX
On the radar| › | Moody's (12 Oct) puts EMEA recap headroom at about EUR 41bn, and expects recaps to stay high until dealmaking recovers. |
| › | SRS Acquiom: the buyer audits your working capital number anyway. Across 1,570+ deals closed 2020 to Q3 2025, 91% of private-target deals carried a working capital price adjustment, and 89% of those ended in a payment. |
 The answer
Cash conversion and working capital. Ranked 9th of 9.
The fastest lever in the survey came last on the priority list. The full list, in FTI's 2026 order, with the share seeing results within 12 months:
| # | Lever | Results within 12 months | |||
|---|---|---|---|---|---|
| 1 | M&A | 25% | |||
| 2 | Product and market expansion | 54% | |||
| 3 | Pricing | 72% | |||
| 4 | Cost structure | 73% | |||
| 5 | Customer health and churn prevention | 57% | |||
| 6 | Supply chain and operations | 68% | |||
| 7 | Workforce effectiveness | 73% | |||
| 8 | Sales force and marketing | 63% | |||
| 9 | Cash conversion and working capital | 82% |
The lever ranked first is the slowest to show results. The one ranked last is the fastest.
Source: FTI Consulting, 2026 Private Equity Value Creation Index (555 PE leaders; rankings p.18, time to value p.7) and Working capital's next chapter.
Interactive: the cash calculator
How much cash is stuck in one of your companies?
Move the sliders to match one portfolio company. The starting values are illustrative, not a benchmark.
Annual revenue
Cost of sales, as a share of revenue
Days customers take to pay
Days of stock held
Tied up today: in what customers owe and in stock.
Days taken out of customer payments
Days taken out of stock
Interest rate on the company's debt
cash released in total
interest saved a year if it pays down debt
from customers paying sooner
from holding less stock
Arithmetic, not a forecast. Cash from customers is revenue ÷ 365 × the days taken out. Cash from stock is cost of sales ÷ 365 × the days taken out. The cash stays in the company, to fund growth, pay down debt or strengthen the balance sheet before a sale. Keeping it released means running receivables and stock well every day.
Find out where the cash is stuck in one company you already own.
Ask us for the cash read and we will tell you the two extracts we need for one portfolio company. We will show you where the two systems disagree, what is aged or slow-moving, and which cash is unmatched. A fast read you can take to the board. No systems access, no project.
Ask us for the cash readOr email tom@g3nr8.com.
Tom
P.S. Tell us what you want more of and we fold it into the next issue. Say what you want.
Keep informed with the newsletter for PE operating partners and the portfolio companies they back.
Get operational insights and trends, AI frameworks, resources and real deployment stories.